| Analysis of Caffeine in Coffee |
| Caffeine Sources Worldwide |
| Effects of Caffeine |
| Temperature Analysis |
| Extraction Method |
| Fragmentation Patterns |
| 3-D Nature of GC/MS |
| References |
| >>>Go to Lab |
|
Three-Dimensional Nature of GC/MS |
|
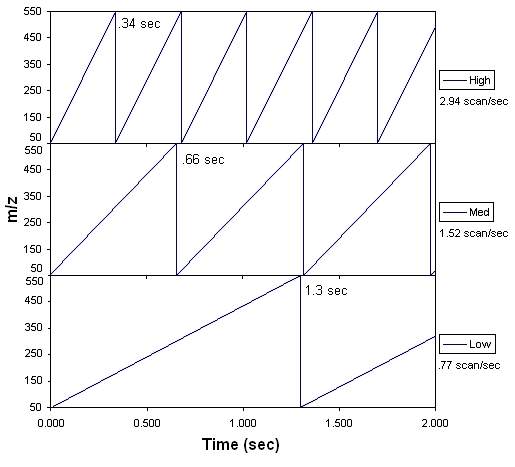
GC/MS takes data in three dimensions simultaneously, recording the number of ions created along with their masses over time. This information is generally represented by examining the total ion chromatogram (TIC) and ‘slicing’ along the third dimension (m/z) of a given peak to look at the mass spectrum at a chosen time. However, this mass spectrum is not taken instantaneously. Only one m/z is measured at any given moment, and this value is varied along a chosen range of m/z. This is very analogous to a UV/Vis spectrophotometer, where the wavelength examined must be swept along the range of interest. The rate at which the examined m/z value is varied can be controlled by the scan rate parameter on a GC/MS. High scan rates include a very short time per scan; since fewer ions will be detected in this time window, the peak height will appear lower than in slower scan rates. However, since more scans are taken in that period of time, the TIC will have better resolution, allowing the narrow peaks to be detected. For slower scan rates, some of that resolution is lost, but the resulting peaks can sometimes be useful for quantization. If the number of ions detected for each m/z scan is summed for all the scans in a single peak, the total number would be the same (lower intensities, but more scans to sum). The choice of m/z range will affect the scan rates possible as the MS itself has a maximum possible speed it can scan. If a large range of m/z is chosen, there will be a minimum time needed to complete a single scan, forcing slower scan rates to be chosen. If a complex unknown mixture is being examined and the components elute close together, they can be measured by choosing a small enough m/z range to be scanned quickly, but wide enough to give worthwhile data. For this case study, the scan rates were chosen through trial and error. These scan rates are shown in the figure and table below. |
|
Total Number of Scans per Assay |
|||
|
Time (minutes) |
High |
Med |
Low |
|
2 |
40 |
78 |
155 |
|
4 |
81 |
157 |
311 |
|
6 |
122 |
236 |
467 |
|
8 |
163 |
315 |
623 |
|
10 |
204 |
394 |
779 |
You may also wish to review the
GC-MS
Tutorial page.